Developer Tools
Developer tools are available on Zenario so that developers can see the codes of different elements of the site in order to locate possible coding errors and bugs that may arise.
To activate this option for an administrator go to Organizer>Users>Administrators then select a user and view the properties. A floating box will appear, click on the permissions tab and then check the 'Use developer tools' option.

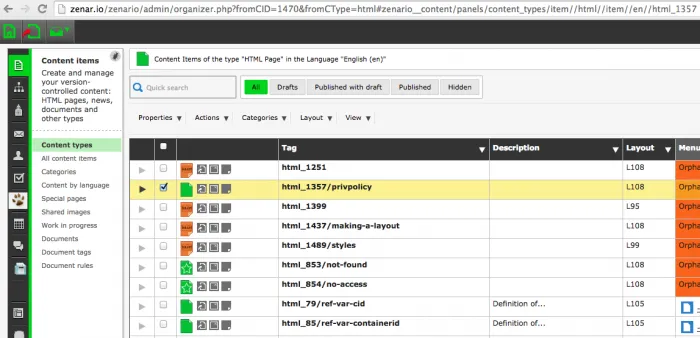
There are URLs, that can act like paths, associated with every element of the CMS. For example when in Organizer on the page that shows all content types, this URL is shown.

When an item is selected however, the URL will change.

Bug mode
Bug mode allows you to view path inspectors, refiners that modify a panel and change which items are displayed, and when clicked a TUIX inspector will open to see the code associated with that element.
To access this information just click on the 'bug' icon that is located in several places:
Organizer

Floating Admin Boxes

and the Admin toolbar

If you select a specific element such as an html page and then hover over the bug icon, you will get specific information regarding that element.

The three path inspector elements are described below.
Mode

Navigation Path

Tag Inspector

TUIX Inspector
When the bug icon is clicked, the Developer Tools will open. This displays the source files, combined source, Storekeeper Queries and current value all selectable from a drop down list at the top.

You can click on an element and a documentation panel will open on the right hand side detailing various attributes:

An asterisk will also appear in the drop down menu, indicating where the source file is.

Diagnostics
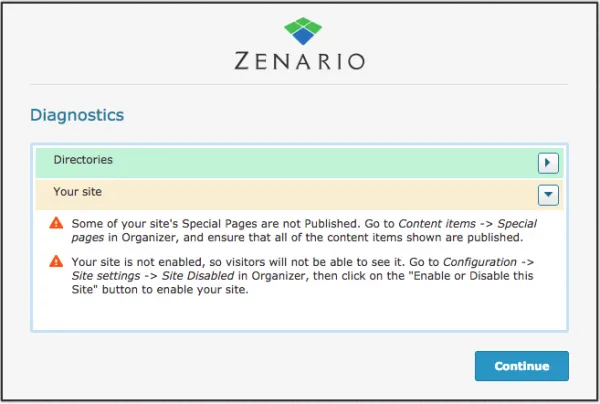
A diagnostics feature is shown (if needed) after logging into Zenario that helpfully describes key elements of your site that may not be functioning properly. It uses a developer.txt file that indicates it's a developer installation and lists the warnings that arise when this file exists.


